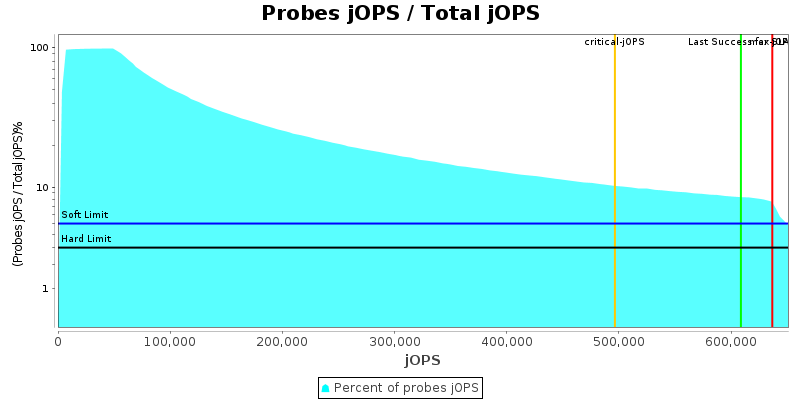
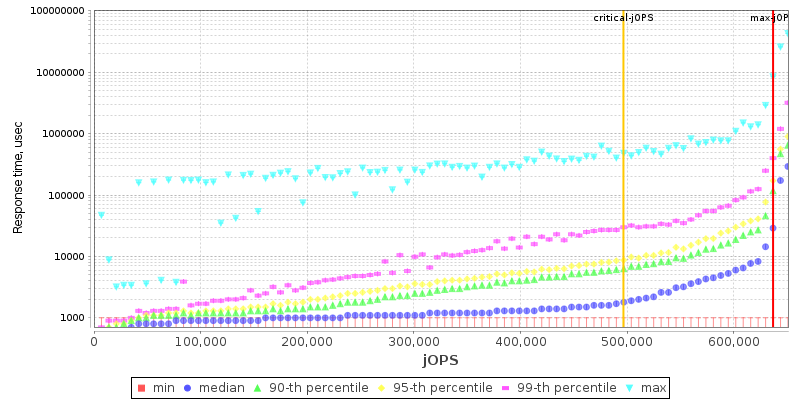
Hewlett Packard Enterprise ProLiant DL385 Gen11 636743 SPECjbb2015-Composite max-jOPS
496432 SPECjbb2015-Composite critical-jOPS
Tested by: Hewlett Packard Enterprise Test Sponsor: Hewlett Packard Enterprise Test location: Houston, TX Test date: May 16, 2023
SPEC license #: 3 Hardware Availability: Jun-2023 Software Availability: Apr-2023 Publication: Tue Jun 13 10:03:08 EDT 2023
Benchmark Results Summary
 
Overall Throughput RT curve
Overall SUT (System Under Test) Description
VendorHewlett Packard Enterprise
Vendor URLhttp://www.hpe.com/
System SourceSingle Supplier
System DesignationServer Rack
Total Systems1
All SUT Systems IdenticalYES
Total Nodes1
All Nodes IdenticalYES
Nodes Per System1
Total Chips2
Total Cores256
Total Threads512
Total Memory Amount (GB)1536
Total OS Images1
SW EnvironmentNon-virtual
 
Hardware hw_1
NameProLiant DL385 Gen11
VendorHewlett Packard Enterprise
Vendor URLhttp://hpe.com/
AvailableJun-2023
ModelProLiant DL385 Gen11
Form Factor2U Rack
CPU NameAMD EPYC 9754
CPU Characteristics128 Core, 2.25 GHz, 256 MB L3 Cache(Max. Boost Clock Up to 3.1 GHz)
Number of Systems1
Nodes Per System1
Chips Per System2
Cores Per System256
Cores Per Chip128
Threads Per System512
Threads Per Core2
VersionA55 v1.30 03/06/2023
CPU Frequency (MHz)2250
Primary Cache32 KB I + 32 KB D on chip per core
Secondary Cache1024 KB I+D on chip per core
Tertiary Cache256 MB (I+D) on chip per chip
Other CacheNone
Disk1 x 480 GB SATA SSD
File Systembtrfs
Memory Amount (GB)1536
# and size of DIMM(s)24 x 64 GB
Memory Details64GB 2Rx4 PC5-38400R , running at 4800 MHz
# and type of Network Interface Cards (NICs)HPE Ethernet 1Gb 4-port
Power Supply Quantity and Rating (W)2 x 1600
Other HardwareNone
Cabinet/Housing/EnclosureNone
Shared DescriptionNone
Shared CommentNone
Notes
  • NA: The test sponsor attests, as of date of publication, that CVE-2017-5754 (Meltdown) is mitigated in the system as tested and documented
  • Yes: The test sponsor attests, as of date of publication, that CVE-2017-5753 (Spectre variant 1) is mitigated in the system as tested and documented
  • Yes: The test sponsor attests, as of date of publication, that CVE-2017-5715 (Spectre variant 2) is mitigated in the system as tested and documented
Other Hardware network_1
NameNone
VendorNone
Vendor URLNone
VersionNone
AvailableNone
BitnessNone
NotesNone
Operating System os_1
NameSUSE Linux Enterprise Server 15 SP4
VendorSUSE
Vendor URLhttp://suse.com/
Version5.14.21-150400.22-default
AvailableJun-2022
Bitness64
NotesNone
Java Virtual Machine jvm_1
NameOracle Java SE 17.0.7
VendorOracle
Vendor URLhttp://www.oracle.com/
VersionJava HotSpot 64-bit Server VM, version 17.0.7
AvailableApr-2023
Bitness64
NotesNone
Other Software other_1
NameNone
VendorNone
Vendor URLNone
VersionNone
AvailableNone
BitnessNone
NotesNone
Hardware
OS Images os_Image_1(1)
Hardware Description hw_1
Number of Systems 1
SW Environment non-virtual
Tuning
  • Workload Profile=High Performance Compute(HPC)
  • Thermal Configuration=Maximum Cooling
  • Determinism Control=Manual
  • Performance Determinism=Power Deterministic
  • Memory Patrol Scrubbing=Disabled
  • Numa Memory Domains Per Socket(NPS)=Two Memory Domains Per Socket
  • Last-Level Cache(LLC) As NUMA Node=Disabled
  • L1 Stream HW Prefetcher=Disabled
  • L2 Stream HW Prefetcher=Disabled
  • Minimum Processor Idle Power Core C-State=No-States
  • xGMI Link Bandwidth=32Gbps
  • Package Power Limit=400
Notes None
OS Image os_Image_1
JVM Instances jvm_Composite_1(1)
OS Image Description os_1
Tuning
  • ulimit -n 1024000
  • UserTasksMax=970000
  • DefaultTasksMax=970000
  • tuned-adm profile throughput-performance
  • echo 990000 > /proc/sys/kernel/sched_rt_runtime_us
  • echo 20000000 > /proc/sys/kernel/sched_latency_ns
  • echo 10000 > /proc/sys/kernel/sched_migration_cost_ns
  • echo 100000 > /proc/sys/kernel/sched_min_granularity_ns
  • echo 40000 > /proc/sys/kernel/sched_wakeup_granularity_ns
  • echo 128 > /proc/sys/kernel/sched_nr_migrate
  • echo 10000 > /proc/sys/vm/dirty_expire_centisecs
  • echo 1500 > /proc/sys/vm/dirty_writeback_centisecs
  • echo 40 > /proc/sys/vm/dirty_ratio
  • echo 10 > /proc/sys/vm/dirty_background_ratio
  • echo 10 > /proc/sys/vm/swappiness
  • echo 0 > /proc/sys/kernel/numa_balancing
  • echo 0 > /proc/sys/vm/numa_stat
  • echo always > /sys/kernel/mm/transparent_hugepage/enabled
  • echo always > /sys/kernel/mm/transparent_hugepage/defrag
Notes None
JVM Instance jvm_Composite_1
Parts of Benchmark Composite
JVM Instance Description jvm_1
Command Line

-Xms1440g -Xmx1440g -Xmn1420g -server -XX:+UseParallelGC -XX:+AlwaysPreTouch -XX:+UseLargePages -XX:LargePageSizeInBytes=2m -XX:MaxTenuringThreshold=15 -XX:-UseAdaptiveSizePolicy -XX:ParallelGCThreads=512 -XX:SurvivorRatio=60 -XX:TargetSurvivorRatio=95 -XX:+UseNUMA -XX:-UseAdaptiveNUMAChunkSizing -XX:+UseTransparentHugePages -XX:InlineSmallCode=11k -XX:TLABAllocationWeight=99 -XX:ThreadStackSize=200 -XX:AutoBoxCacheMax=32 -XX:OnStackReplacePercentage=100 -XX:TLABSize=64M

Tuning

Used numactl to bind the JVM to all NUMA nodes available on the SUT

  • numactl --cpunodebind=0-3 --interleave=0-3
Notes None
max-jOPS = jOPS passed before the First Failure
Pass/Fail Pass Pass Pass Fail Fail
jOPS 622749 629746 636743 643741 650738
critical-jOPS = Geomean ( jOPS @ 10000; 25000; 50000; 75000; 100000; SLAs )
Response time percentile is 99-th
SLA (us) 10000 25000 50000 75000 100000 Geomean
jOPS 310208 465312 570270 598258 612253 496432
  Percentile
  10-th 50-th 90-th 95-th 99-th 100-th
500us 160935 / 167932 13994 / 20992 - / 6997 - / 6997 - / 6997 - / 6997
1000us 538783 / 545780 230907 / 237904 48980 / 55977 41983 / 48980 34986 / 41983 - / 6997
5000us 629746 / 636743 587763 / 594760 440822 / 447820 384845 / 377848 258896 / 265893 76969 / 6997
10000us 636743 / - 622749 / 629746 552777 / 559774 510794 / 517791 321870 / 286884 76969 / 6997
25000us 636743 / - 629746 / 636743 615752 / 622749 587763 / 594760 461814 / 468811 76969 / 6997
50000us 636743 / - 636743 / - 629746 / 636743 622749 / 629746 566772 / 573769 132946 / 41983
75000us 636743 / - 636743 / - 629746 / 636743 622749 / 629746 594760 / 601757 195921 / 41983
100000us 636743 / - 636743 / - 629746 / 636743 629746 / 636743 608755 / 615752 195921 / 41983
200000us 636743 / - 636743 / - 636743 / - 636743 / - 622749 / 629746 363853 / 125949
500000us 636743 / - 636743 / - 636743 / - 636743 / - 636743 / - 531786 / 419831
1000000us 636743 / - 636743 / - 636743 / - 636743 / - 636743 / - 594760 / 601757
Probes jOPS / Total jOPS
Request Mix Accuracy
Note
(Actual % in the Mix - Expected % in the Mix) must be within:
'Main Tx' limit of +/-5.0% for the requests whose expected % in the mix is >= 10.0%
'Minor Tx' limit of +/-1.0% for the requests whose expected % in the mix is < 10.0%
There were no non-critical failures in Response Time curve building
Delay between status pings
IR/PR Accuracy
This section lists properties only set by user
Property Name Default Controller
specjbb.comm.connect.selector.runner.count 0 1
specjbb.comm.connect.worker.pool.min 1 16
specjbb.controller.maxir.maxFailedPoints 3 1
specjbb.controller.rtcurve.warmup.step 0.1 0.4
specjbb.customerDriver.threads 64 {=64, probe=64, saturate=64}
specjbb.forkjoin.workers 512 {=64, Tier1=58, Tier2=1, Tier3=6}
specjbb.group.count 1 8
specjbb.heartbeat.period 10000 50000
specjbb.heartbeat.threshold 100000 500000
specjbb.mapreducer.pool.size 512 1
View table in csv format
 
Level: COMPLIANCE
Check Agent Result
Check properties on compliance All PASSED
 
Level: CORRECTNESS
Check Agent Result
Compare SM and HQ Inventory All PASSED
High-bound (max attempted) is 699718 IR
High-bound (settled) is 677739 IR